

iNaturalist Papilio polyxenes asterius Observations and Comparisons to Extreme Weather from 2020 to 2025
- Jen Lichtefeld
- Nov 17, 2025
- 17 min read


Jennifer L. Lichtefeld
Owner, Butterfly Breeder
Blinque’s Butterfly Garden
Biology Department, Miami University
Cincinnati, Ohio, USA
Foundations of Inquiry, 2025
Papilio polyxenes asterius, or the Eastern Black Swallowtail, is a striking but common butterfly found in every state east of the Rocky Mountains as well as Eastern parts of Canada and Mexico (Hall, 2024). Their larvae use Apiaceae, or members of the carrot family, as their host plant, which has many wild native forms across the US, as well as common use in agriculture. The butterfly’s eggs are yellow and round, which can be very difficult to see when laid in the bloom of some of their host plants. The larvae have excellent camouflage, as well. In early instars, they disguise themselves as bird droppings. Later instars are green with black stripes and orange spots. Pupae can be brown in color or green with yellow markings. The adult form is black with white spots on the body and two rows of pale-yellow spots on the back of their wings. Males will have brighter and more pronounced yellow coloring. Females have prominent blue coloring on the back of the hindwings around the spots. Both sexes have a red eye spot on the inner-hind margin of the hind wings and a yellow spot on the costa of the front wings. The ventral view of their wings has rows of white to pale orange spots on the front wings and bright orange spots with powdery blue on the hindwings. Being swallowtails, they also have the distinct shape to their wings characteristic of the Papilionidae family: large, pointed forewings and rounded hindwings with “tails”.
The species has evolved to have many defenses from their natural predators. Aside from the numerous general Lepidoptera predators, there are three tachinid fly parasitoids and at least five hymenopterous parasitoids of the species (Hall, 2024). As previously stated, their eggs can go unnoticed in the blooms of their host plant. Larvae in early instars appear as bird droppings, warding off any predators that may otherwise try to eat them. Later instars can blend in with their host plant despite being quite large. They also make use of their osmeterium to ward off predators. When provoked, the larvae inflate these two orange horn-like structures behind their head to dispense a chemical repellent. Pupae in either form are hard to detect when attached to most vegetation. Adults are mimics of the poisonous Pipevine Swallowtail, Battus philenor. The resting position shows their mimicking of the ventral patterns to the Pipevine’s wings. Black Swallowtails will stay in this position when roosting for protection. Females are also easily confused with Pipevine Swallowtails from the dorsal side of their wings.
Black Swallowtails are common in forested areas. Despite using some host plants that are also consumed by humans, they are not seen as a major agricultural threat. They can fall victim to pesticide and herbicide use due to one of their chosen host plants, Foeniculum vulgare ‘Purpureum’, being used as ornamental foliage (“Foeniculum vulgare “purpureum” - plant finder”, n.d.).
Sightings of this butterfly are common on iNaturalist. The database has thousands of verified observations logged for the Eastern Black. User growth has been exponential for iNaturalist, increasing the number of observations on the site every year to roughly doubled (Di Cecco et al., n.d.). Despite this growth and the widespread range of the Eastern Black Swallowtail, a sharp decline in observations was seen for the species in the first half of the year in 2025 when compared to the same time period last year. When looking at verified observations [observations containing a valid date, a location, has photo or sound, and isn’t of a captive/cultivate organism (Cox, 2019)] in the US portion of the species native range, there was a drop of 48.7% from 2024 to 2025. From January 1st of 2025 to June 30th of 2025 in the US, there were 3,771 observations recorded on iNaturalist when 2024 of the same date range had 7,742 observations (“Observations”, n.d). With the growth of data being added to the website and a steadily increasing number of observations for the species seen over the last several years, this drop appears significant.
Table 1
Observations of P. polyxenes asterius on iNaturalist from the first half of each year
Year | National Observations | Texas Observations |
2020 | 3569 | 1289 |
2021 | 3400 | 842 |
2022 | 3752 | 1328 |
2023 | 6663 | 3813 |
2024 | 7445 | 3648 |
2025 | 3648 | 918 |
Another butterfly species that has seen a recent drop in population counts is Danaus plexippus, the Monarch butterfly (Taylor, 2024), but a theory for the decline is that aside from habitat loss and pesticide use (Van Deynze et al, 2024), extreme weather conditions in certain times of the year will drive down numbers temporarily. Taylor has proposed that elevated temperatures in March through September, extreme low temperatures in the early Spring, droughts in Texas specifically, and freezing temperatures in late Spring are negatively affecting Monarch population counts at breeding sites (Taylor, 2024). Could the drop in observations on iNaturalist for the Eastern Black Swallowtail for the first half of the year in 2025 be correlated to extreme weather events or is the drop in observations independent of weather conditions? A comparison without correlation would indicate another cause for the drop in observations when an increase would be expected due to the increase in data added to the database each year. The possible causes being the next larger threats to most Lepidoptera species: habitat loss and pesticide use (“Threats”, n.d.).
Papilio polyxenes asterius is a species that is included on the USDA’s butterfly release matrix (“Butterfly Environmental Release Decision Chart for each …”, 2019), meaning it can be shipped across state lines by breeders to be used in butterfly release ceremonies. If a particular extreme weather condition can affect the sightings of the Black Swallowtail Butterfly, this could help butterfly farmers who depend on wild genetics to diversify their stock. If the predictors for a low early season brood of P. polyxenes asterius is detected, then farmers would know they’ll need to source new genes from other breeders.
Methods
Observation data was collected from iNaturalist for the full range of the species' habitat east of the Rocky Mountains, state by state. States reviewed were Alabama, Arkansas, Connecticut, Delaware, Florida, Georgia, Illinois, Indiana, Iowa, Kansas, Kentucky, Louisiana, Maine, Massachusetts, Maryland, Michigan, Minnesota, Mississippi, Missouri, Montana, Nebraska, New Hampshire, New Jersey, New York, North Carolina, North Dakota, Ohio, Oklahoma, Pennsylvania, Rhode Island, South Carolina, South Dakota, Tennessee, Texas, Vermont, Virginia, West Virginia, and Wisconsin. The data was logged in bi-monthly intervals from the 1st to the 15th and from the 16th to the end of each month. The collected data consisted of verifiable observations, which are observations that have sufficient data to reach research-grade status, but are not necessarily confirmed by other users. The number of observations and the number of observers for each state and all states combined were recorded for each interval. The state with the most observations was Texas, so for weather comparisons, Texas will be the defined location reviewed. Texas has a longer season for the species to be active and a larger area than all other states in its range. Texas droughts are also part of a theory for the decline in Monarch populations.
The observation numbers of the top observers for the species were collected. Top observers were any observer with more than 100 observations of P. polyxenes asterius from January 1st of 2020 to June 30th of 2025. There are seven observers nationally who meet this requirement. Of those top seven, three are in the state of Texas. The number of observations of the species from each of these top observers in every time interval was recorded. Total observations and total observers in the chosen states combined were also collected for each time interval, regardless of the species observed. These figures more accurately provide the activity level of iNaturalist users in the specified area. The total number reported by iNaturalist at year-end for 2019-2024 for the whole database was collected to look for trends in growth rate. The 2025 figure was not able to be released at the time of this research.
Weather data was collected from the National Centers for Environmental Information Past Weather tool. The tool cannot return all weather stations in every state, so the most centralized station with full data available was used. For Texas weather stations, the most centralized station and the furthest stations North, South, East, and West in the state were utilized. Available information is the daily records of average temperature, maximum temperature, minimum temperature, precipitation level, snowfall level, and snow depth. Dates with freezing temperatures were collected and dates with extreme heat. Freezing temperatures are below 32 degrees Fahrenheit on average for the day and any day reaching below 32 Fahrenheit for the low of the day. Both conditions were recorded separately. Extreme heat can be defined in many ways, but a simple definition from the EPA (2025) is any day reaching above 95 degrees Fahrenheit on average for the day and any day reaching above 95 degrees Fahrenheit for the high of the day. Both conditions were also recorded separately. Prolonged exposure to these conditions are widely accepted to be lethal for butterflies.
Figure 1
Drought Monitor Map of Texas from 2020 to 2025
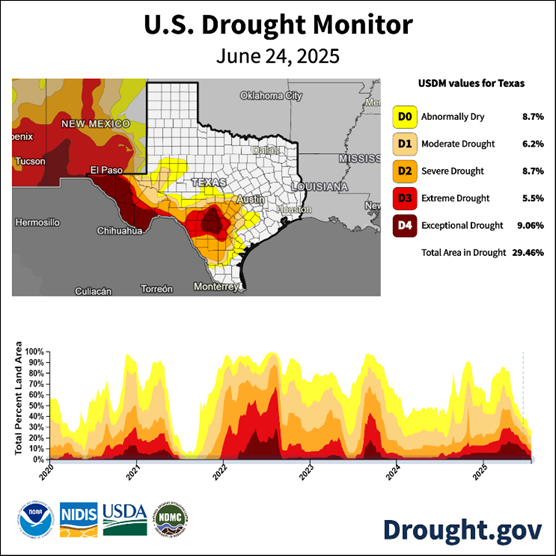
The percentage of the state of Texas experiencing above average drought or rain for every month of the time intervals studied was retrieved from Drought.gov. The total of each category for drought (D0, D1, D2, D3, D4) or wet (W0, W1, W2, W3, W4) was determined then the average for the top two categories of drought or wet (D4, D3, W3, W4) and the lower categories (D2, D1, D0, W0, W1, W2). The numbers were compared in each year and if the total average dry was higher than the total average wet, then the year could be considered a dry year. If the total average wet was higher than the total average dry, then the year could be considered a wet year. The averages of the extreme wet or extreme dry were then observed in the same manner as the overall totals. All of these figures were compared to the total observations in Texas using Spearman’s rank correlation to determine if there was a significant correlation between the drought levels and observations on a monthly basis.
All observations for the time intervals were recorded from iNaturalist and the average, standard deviation, and any outliers for every interval was calculated. Then the intervals were grouped to form three two-month long intervals of Jan 1st to the end of February, March 1st to the end of April, and May 1st to the end of June. A significance level of 0.05 was used on each interval.
Results
A significant correlation was found between drought data and observations through Spearman’s rank correlation. When the monthly figures are compared for each drought category and monthly observations of P. polyxenes asterius in Texas, the D4 and D3 occurrences had a medium negative correlation to observations with Spearman’s rank correlation coefficient being -0.3789 for D4 and -0.3292 for D3. The P-value for each was 0.02268 for D4 and 0.04991 for D3. The covariance of both D4 and D3 were negative. No other drought categories were found to have a significant correlation to observations when isolated to the state of Texas. There was also no significant correlation when looking at total days of extreme heat, extreme cold, or extreme weather in general for each year and observation data.
Table 2
Spearman’s Rank Correlation Results for Drought Levels vs Observations
Parameter | D4 Value | D3 Value |
Spearman’s rank correlation coefficient (rs) | -0.3789 | -0.3292 |
P-value | 0.02268 | 0.04991 |
Covariance | -41.6 | -36.5286 |
Most of Texas does not reach freezing temperatures outside of the winter months. The weather conditions reported from the most Western, Northern, and most central stations had late freezes. A late freeze, in this study, being any day with the minimum temperature of the day reaching 32 degrees Fahrenheit after March 1st. This has occurred every year in the Northern station. It occurred in 2020, 2021, 2022, 2023, and 2025 for the most central location. For the Western station, a late freeze happened in 2021, 2022, and 2023. The latest freezes, being a freeze after April 15th, happened on April 15th-17th of 2020, April 17th-22nd of 2021, April 17th of 2022, and on April 16th and 23rd of 2023.
When reviewing the extreme dry vs extreme wet by using all categories for each, every year would be considered a dry year for the total of the percentage of Texas experiencing some level of drought vs excessive precipitation. If only reviewing the top two categories of drought or wet, then each year except for 2024 would be considered a dry year. For 2024, the figures are very close either way with much of the state experiencing extreme drought and extreme wet in similar levels. For 2024, the average percentage of Texas experiencing W4 and W3 levels of wet weather was 2.6167, while the average percentage of Texas experiencing D4 and D3 levels of drought was 0.93. When looking at the averages of each category in every year, the years with the most percentage of Texas experiencing the highest level of drought were 2022, 2025, and 2021. The year with the largest average of the highest level of wet weather was 2024 with an average of 1.63% of Texas experiencing the W4 level of wet during the first half of that year.
Figure 2
Average Percentage of Texas in Drought Categories

The weather data for Texas was sorted to number of days with the average temperature at or below 32 degrees Fahrenheit, number of days with the maximum temperature at or below 32 degrees Fahrenheit, number of days with the minimum temperature at or below 32 degrees Fahrenheit, number of days with the average temperature at or above 95 degrees Fahrenheit, number of days with the maximum temperature at or above 95 degrees Fahrenheit, number of days with the minimum temperature at or above 95 degrees Fahrenheit, and number of days with subzero temperatures for each year. The only outlier from each category was the single day out of all the time intervals where the average temperature was above 95 degrees Fahrenheit in 2022. The coldest years with the most days with the average temperature, maximum temperature, or the minimum temperature reaching 32 degrees or below were 2022, 2021, and 2025 in order of most cold days. This correlates with the years when a polar vortex entered Texas in late winter (“Historic January 2025 snowstorm in the southern U.S”, 2025; “The Great Texas Freeze”, 2025), except for 2022, where a polar vortex did not cause the winter storms. The years with the most days with the average temperature, maximum temperature, and minimum temperature reaching 95 degrees or above were 2022, 2020, and 2024. There were heat waves affecting Texas in 2020 (Cappucci & Samenow, 2020), late 2022 (Zuvanich, 2022), and May of 2024 (“Climate change intensifying record-breaking may heat in Texas”, 2025). The years with the most combined days with extreme weather were 2022, 2021, and 2020. Particularly of interest is 2022 where extreme cold and extreme heat occurred within the first six months of the year.
Extreme high temperatures, or for this study, any day where the maximum temperature reached 105 degrees or higher, occurred on 5/19/2020, 6/10/2021, 6/23/2021, 5/7/2022, 5/8/2022, 5/15/2022, 5/18/2022, 5/19/2022, 5/20/2022, 6/6/2022, 6/11/2022, 6/12/2022, 6/12/2022, 6/13/2022, 6/20/2023, 6/25/2023, 6/25/2023, 6/26/2023, 6/27/2023, 6/28/2023, 6/4/2024, 6/7/2024, and 6/13/2024. The early high heat days, dates before June, were seen in 2020 and 2022. The most days of high heat in a year occurred in 2022, which was also the driest year from 2020 onwards.
The average growth rate of observations and users on all of iNaturalist from 2020-2024 is 32.38% growth of observations and 34.97% growth of users. The data used displays a huge boost in observations and users during 2020, which correlates to the year of Covid-19 quarantines and much higher use for all online platforms. If the growth rate from 2020 is excluded, the average growth rate of observations changes to 21.21% and the average growth rate of users is 23.84%. The 2025 growth rate cannot be calculated midyear, but the reported number of users by July 1st of 2025 was 9,031,633 and the reported number of observations was 36,333,952 using data from the iNaturalist stats page.
The observations of the top observers of P. polyxenes asterius were grouped by year and the growth rate of each year was determined. Then the observations of the top observers in the state of Texas were recorded and the growth rate determined again. For the top observers, positive growth rates were seen every year until 2024. For 2024 and 2025, the growth rate was negative, with 2025 being a substantial drop. With the total observers in Texas, a negative growth rate was observed in 2021, 2024, and 2025, with 2025 being a substantial drop again. The number of observations from the three top observers in Texas for the P. polyxenes asterius in the first six months of every year from 2020 onwards were 96, 82, and 55 representing 82%, 73%, and 45% of their overall observations of the species.
When reviewing the smaller intervals of time for Texas observations, no outliers were found. An outlier was present in two of the three larger intervals recorded. For the January to February interval, the 2024 February 16th to February 28th total observations was an outlier at 43 observations. For the March to April interval, the 2024 April 16th to April 30th total observations was an outlier at 1008 observations.
Discussion
The significant correlation between extreme drought and observations through Spearman’s rank correlation indicates drought conditions can negatively affect sightings of P. polyxenes asterius in the first six months of a year. The D4 and D3 categories both had a medium negative correlation to observations, meaning as the percentage of Texas experiencing those conditions increases in the early part of a year, the fewer observations that are being recorded in iNaturalist for the Black Swallowtail. The P-values for each indicates support for the hypothesis of a correlation between the area in extreme drought and observations. Since no other drought categories were found to have a significant correlation to observations when isolated to the state of Texas, moderate drought and moderate to higher levels of precipitation do not significantly affect observations of the butterfly in iNaturalist. Total days of extreme heat, extreme cold, or extreme weather in general are also not found to have a significant impact on iNaturalist observations of Black Swallowtails.
Most of the extreme weather conditions theorized to affect Monarch populations do not fully explain the drop in observations in 2025 of the Papilio polyxenes asterius. Drought was most prevalent in 2022, 2021, and 2025. Observations did drop by 34.7% in 2021 and 74.8% in 2025, but the observations in Texas grew in 2022 and by 57.7%. The larger growth rate in 2022 could be a return to the normal population size for the species as it was in 2020, and would only be a growth of 2.9% from 2020 to 2022. The observations more than doubled from 2021 to 2022 despite 2022 being the driest year since 2020. The year with the most days of extreme heat was also 2022, and it was the year with the most days of extreme cold. These conditions would be expected to also show a drop in observations instead of the growth recorded. There were recorded freezing temperatures in areas of Texas in late April for a few sites. A freeze that spanned to three sites across the state occurred in 2021. The sites were the furthest North, central and Westward. Extreme cold temperatures were seen in the North of Texas almost every year except 2024. This did not negatively impact the observations seen in 2021.
The yearly growth rates of users and observations on iNaturalist indicate observations of P. polyxenes asterius should increase each year proportionally as long as the wild population holds steady. The growth rate figures confirm the continued growth of users and observations on iNaturalist. There is no indication of a decline in overall users or observations since 2020. Therefore, the large drop in observations in 2025 is biologically significant. The top observers for the species nationally and in Texas also saw a large drop in observations in 2025, reducing the chances of the 2025 drop being a user error or misidentifications of the butterfly.
A possible reason for the drop in observations could be related to socially significant events preventing the country as a whole from making as many observations in the first half of 2025. Pesticide use is widespread and increasing in the US, which could also be a contributing factor that was not included in this study. Habitat loss could affect the Black Swallowtail, but its range is so vast and its host plants so readily found, that it seems unlikely this species is experiencing notable habitat loss. There is a possibility of an increase in natural predators causing the observation drop, as well, that was not reviewed in this study.
Conclusion and Reflections
The well documented top causes of all insect decline are climate change, pesticides, and habitat loss. Pesticide use could potentially be the answer to the substantial drop in observations for Papilio polyxenes asterius in 2025, but the extreme drought occurrences in January to the end of June have a moderate negative impact. Specifically, the drop in observations on iNaturalist for the Eastern Black Swallowtail for the first half of the year in 2025 correlates to extreme drought. Human development of land that was a habitat for the species has diluted species richness in other locations globally (Stefanescu et al, 2004), which would only add to any drop from the droughts and any pesticide use. The extreme droughts are part of the broad crisis of climate change.
As droughts become more common with the advancement of climate change, it could be possible to find the threshold of drought that can be experienced before the sightings of the Black Swallowtail begin to decline. If those thresholds are known and can be monitored, this could be an indicator for butterfly breeders to attempt to keep any stock of Black Swallowtails protected from the elements. In general, the public could help all butterflies and insects by providing them with access to water when possible, such as placing shallow bowls of water out for them when significant droughts are prevalent. Unfortunately, this may not be possible if droughts are affecting the amount of water that can be supplied to humans. Droughts are a natural phenomenon that are not fully preventable, but humans can take measures to mitigate their impacts with water conservation and water management policies focused on sustainability.
Future studies should review pesticide use, looking at overall use of all pesticides and the use of the top-most used pesticides. Looking at data over the full year, and not just the first part of the year, could also show some significant link between observations of this species and extreme weather, such as a longer winter season influencing the number of P. polyxenes asterius seen in the early Spring. While the study focused on the year 2020 and onwards, observation data on iNaturalist before 2020 could also be incorporated. It was not used in this study due to the abundance of data seen from 2020 onwards as the effects of Covid-19 lockdowns increased awareness and use of the application.
Observations on iNaturalist do not necessarily reflect the actual population of a species, so it is not possible to say there is a correlation between droughts and butterfly populations. There are butterfly counts carried out each year through the North American Butterfly Association that could give a closer indication of population decline, however the historical data for these counts could not be obtained in the timeframe of this study. Obtaining that data and looking for correlations with those figures could be more impactful for future studies.
References
Cappucci, M., & Samenow, J. (2020, May 5). Long-lasting, record-setting heat is roasting zone from California to Texas - The Washington Post. Washington Post. https://www.washingtonpost.com/weather/2020/05/05/southwest-record-heat/
Climate change intensifying record-breaking may heat in Texas. Climate Central. (2025, May 12). https://www.climatecentral.org/climate-shift-index-alert/texas-may-2025
Cox, G. (2019, August 6). What is a “verifiable observation” and how does it reach “research grade”? iNaturalist. https://www.inaturalist.org/posts/26549-what-is-a-verifiable-observation-and-how-does-it-reach-research-grade
Di Cecco, G. J., Barve, V., Belitz, M. W., Stucky, B. J., Guralnick, R. P., & Hurlbert, A. H. (n.d.). Observing the observers: How participants contribute data to inaturalist and implications for biodiversity science | bioscience | oxford academic. https://academic.oup.com/bioscience/article/71/11/1179/6357804
Environmental Protection Agency. (2025, March 27). Climate Change Science. EPA. https://www.epa.gov/climatechange-science/extreme-heat
The Great Texas freeze: February 11-20, 2021. National Centers for Environmental Information (NCEI). (2025, February 28). https://www.ncei.noaa.gov/news/great-texas-freeze-february-2021
Hall, D. (2024, November 18). Eeny-504/IN906: Eastern black swallowtail: Papilio polyxenes asterius (stoll) (Insecta: Lepidoptera: Papilionidae). Ask IFAS - Powered by EDIS. https://edis.ifas.ufl.edu/publication/IN906
Historic January 2025 snowstorm in the southern U.S. NOAA Climate.gov. (2025, January 29). https://www.climate.gov/news-features/event-tracker/historic-january-2025-snowstorm-southern-us#:~:text=Texas%20saw%20the%20first%20snowflakes,began%20its%20records%20in%201901.
Historical data and conditions. Drought.gov. (n.d.). https://www.drought.gov/historical-information?dataset=0&selectedDateUSDM=20250715
Missouri Botanical Garden. (n.d.). Foeniculum vulgare “purpureum” - plant finder. Plant Finder. https://www.missouribotanicalgarden.org/PlantFinder/PlantFinderDetails.aspx?kempercode=d612
Observations. iNaturalist. (n.d.). https://www.inaturalist.org/observations?captive=false&d1=2024-01-01&d2=2024-06-30&place_id=1&taxon_id=58523
Sarnoff, L. (2024, May 2). First heatwave of the year expected to hit Southern states next week. ABC News. https://abcnews.go.com/US/heatwave-year-expected-hit-southern-states-week/story?id=109878274
Stefanescu, C., Herrando, S., & Páramo, F. (2004). Butterfly species richness in the north‐west Mediterranean Basin: The role of natural and human‐induced factors. Journal of Biogeography, 31(6), 905–915. https://doi.org/10.1111/j.1365-2699.2004.01088.x
Taylor, C. (2024, April 2). Is the eastern monarch population continuing to decline?. Monarch Watch. https://monarchwatch.org/blog/2024/03/29/is-the-eastern-monarch-population-continuing-to-decline/
Threats. Monarch Joint Venture. (n.d.). https://monarchjointventure.org/monarch-biology/threats
White, R. H., Anderson, S., Booth, J. F., Braich, G., Draeger, C., Fei, C., Harley, C. D. G., Henderson, S. B., Jakob, M., Lau, C.-A., Mareshet Admasu, L., Narinesingh, V., Rodell, C., Roocroft, E., Weinberger, K. R., & West, G. (2023, February 9). The unprecedented Pacific Northwest Heatwave of June 2021. Nature News. https://www.nature.com/articles/s41467-023-36289-3
United States Department of Agriculture. (2019, October 7). Butterfly Environmental Release Decision Chart for each ... https://www.aphis.usda.gov/sites/default/files/decision_chart.pdf
Van Deynze B, Swinton SM, Hennessy DA, Haddad NM, Ries L (2024). Insecticides, more than herbicides, land use, and climate, are associated with declines in butterfly species richness and abundance in the American Midwest. PLoS ONE 19(6): e0304319. https://doi.org/10.1371/journal.pone.0304319
Zuvanich, A. (2022, August 2). Houston just had its hottest July ever as 2022 Heatwave continues breaking records. Houston Public Media. https://www.houstonpublicmedia.org/articles/news/weather/2022/08/02/429757/houston-just-had-its-hottest-july-ever-as-2022-heatwave-continues-breaking-records/

Comments